In this manual you’ll see how to fill in an Outlook table with the data from different datasets in a few clicks. I’ll show you how to bind them correctly using Shared Email Templates.
As unreal as it sounds for now, as easy it’ll become once you finish reading this tutorial :)
First off, I’d like to take a moment to make a small introduction for our blog newcomers and tell a few words about our Shared Email Templates app for Outlook. With this handy add-in you’ll multiply your productivity and email correspondence greatly. You’ll have your personal or shared pre-saved templates that will become ready-to-be-sent emails in a single click. No worries about hyperlinks, coloring or other kind of formatting, all will be preserved.
You may install Shared Email Templates on your PC, Mac or Windows tablet right from Microsoft Store and check out its functionality for your personal use-cases. Our manuals on Docs and variety of blog articles will help you get a complete understanding of the tool’s functionality and encourage you to make them a part of your workflow ;)
How to fill in several table rows from single dataset line
To show you how to fill in different rows from one dataset I’ll be using basic samples so that you could get the idea and then optimize those techniques for your own data.
Tip. In case you’d like to refresh your memory about datasets, you may get back to my Create fillable templates from datasets tutorial, I got this topic covered for you ;)
So, my sample dataset would be the following:
| Key column | A | B | C | D |
| 1 | aa | b | c | 10 |
| 2 | aa | bb | cc | 20 |
| 3 | aaa | bbb | ccc | 30 |
The first column is, as usual, the key one. The rest of the columns will populate multiple rows of our future table, I’ll show you the steps to take.
Tip. Feel free to copy this table as your own dataset and run a few tests of your own ;)
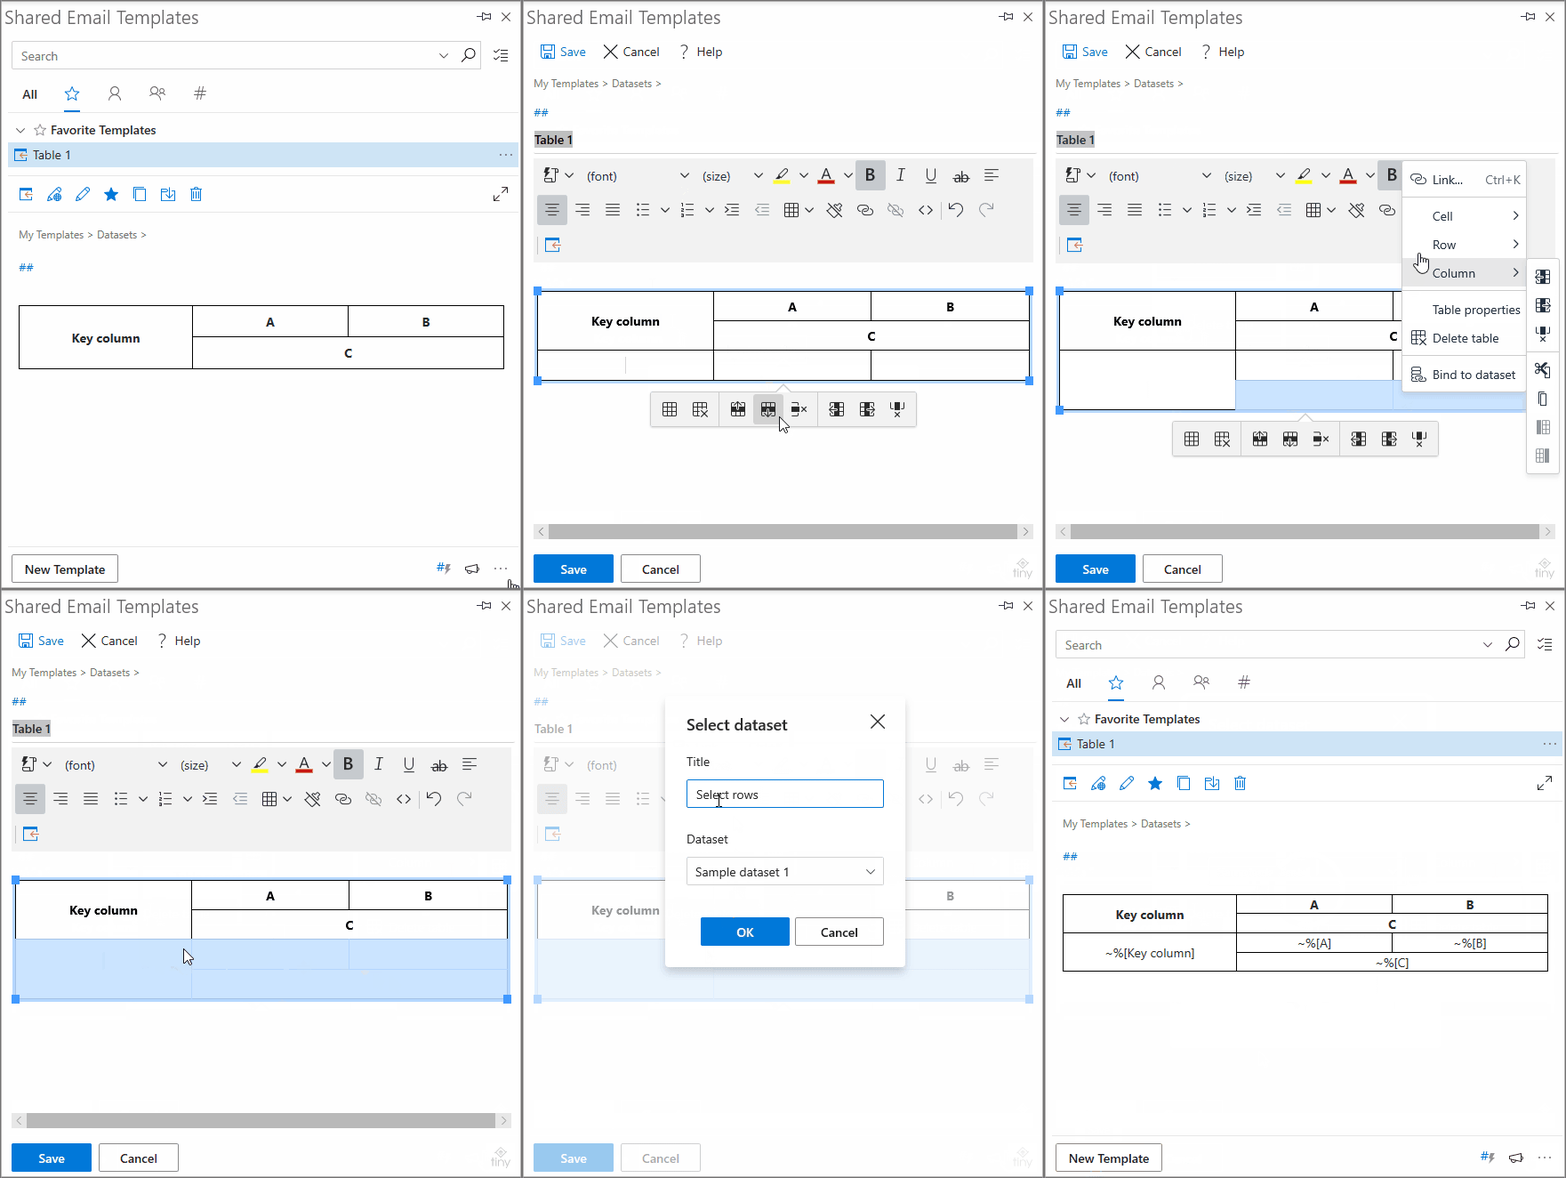
First off, I need to create a table. As I’ve described in my tables tutorial, you simply hit the Table icon when creating/editing a template and set a range for your future table.
As my task is to complete several lines with the data from one and the same dataset, I’d better merge a few rows of the first column together so that the other columns got associated with this cell. I’d also merge a few more columns to prove you that merged cells won’t be a problem for datasets.
So, the pattern of my future template will be the following:
| Key column | A | B |
| C | ||
See, I’ve merged the two rows of the key column and two columns of the second row. BTW, don’t forget to get back to my Merge cells in Outlook tutorial in case you missed it :)
So, let’s bind our dataset and see how it works. I’ve added two more rows, merged the necessary cells in the same fashion and connected to a dataset.

Here is what I’ve got in my template in the result:
| Key column | A | B |
| C | ||
| ~%[Key column] | ~%[A] | ~%[B] |
| ~%[C] | ||
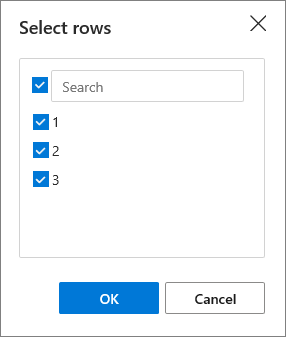
When I paste this template, I’ll be asked to choose the dataset rows to insert in a table.

As I selected all of the dataset rows, all of them will fill in the sample table we have. Here is what we’ll get in the result:
| Key column | A | B |
| C | ||
| 1 | a | b |
| c | ||
| 2 | aa | bb |
| cc | ||
| 3 | aaa | bbb |
| ccc | ||
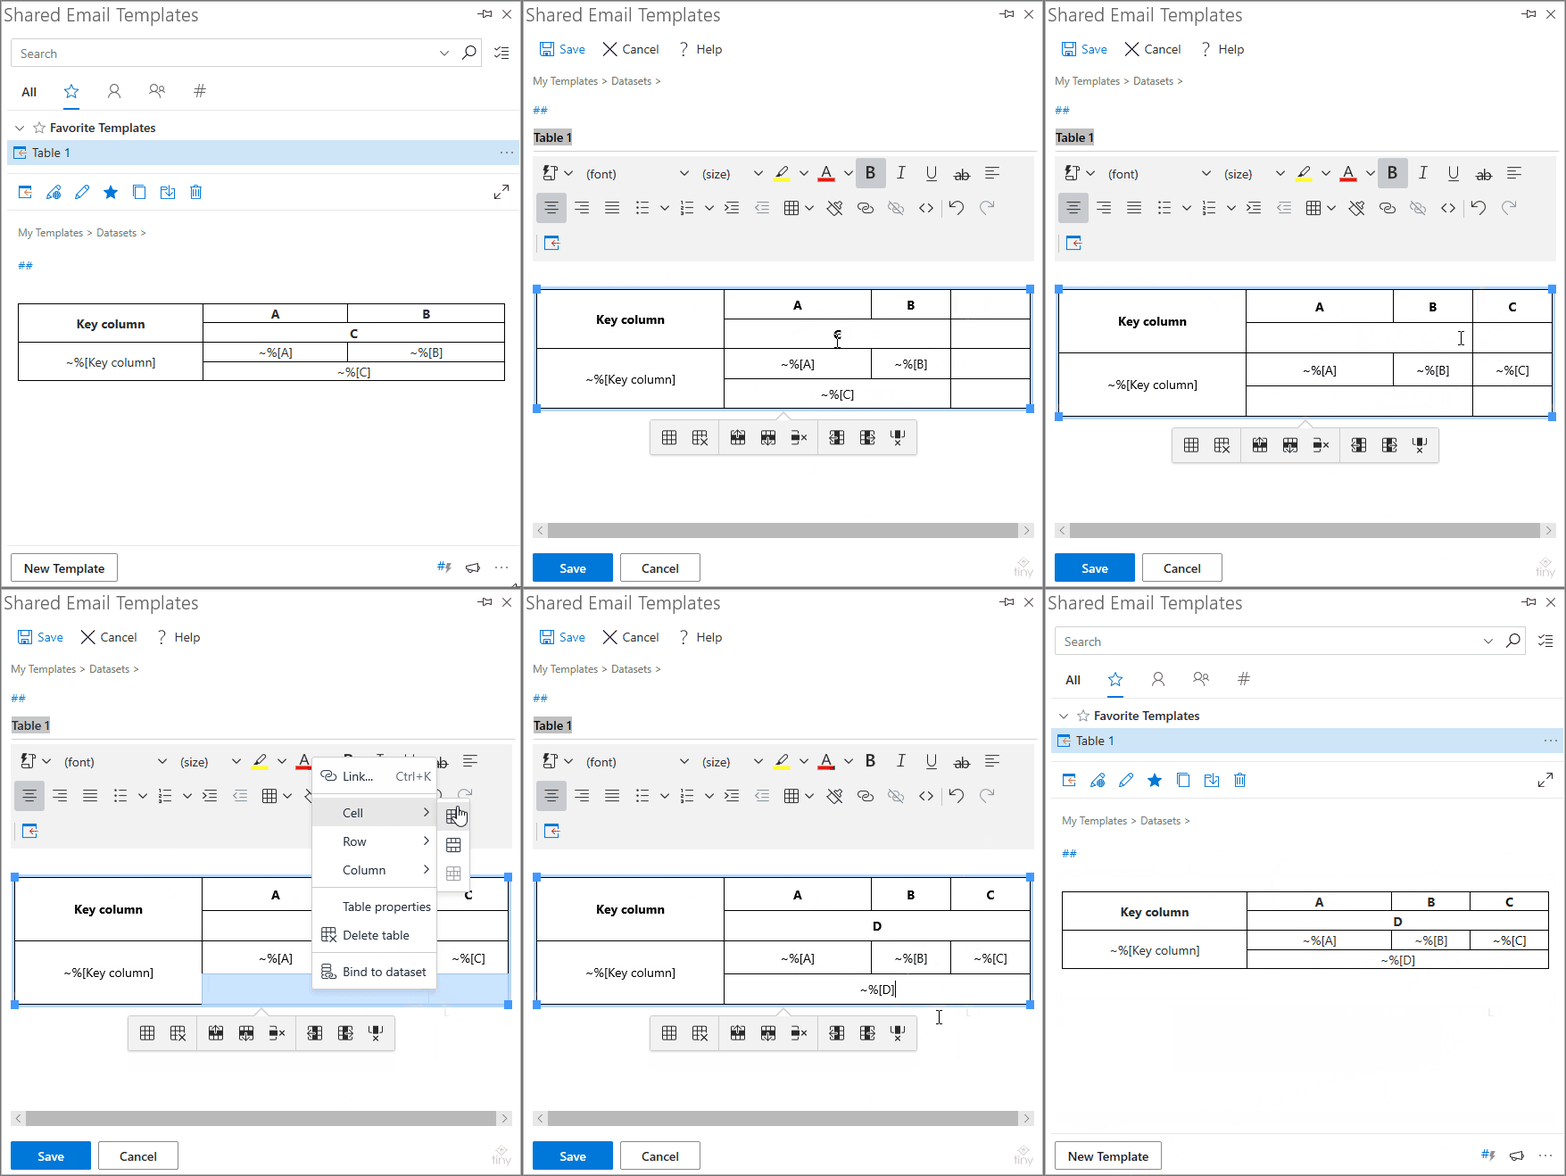
You must have already noticed that something is missing in my resulting table. That’s right, column D was cut off as the current cells’ arrangement leaves no place for it. Let’s find a place for the abandoned column D :)
I’ve decided to add a new column to the right of my table and rearrange the data a little.

Note. As I already have my dataset connected to the second row, there is no need to bind it once again. You just put the name of the new column in the desired cell and it’ll work perfectly.
Here goes my new resulting table:
| Key column | A | B | C |
| D | |||
| ~%[Key column] | ~%[A] | ~%[B] | ~%[C] |
| ~%[D] | |||
Now I have place for each column of my dataset so when I paste it, all the data will populate my email, no more losses.
| Key column | A | B | C |
| D | |||
| 1 | a | b | c |
| 10 | |||
| 2 | aa | bb | cc |
| 20 | |||
| 3 | aaa | bbb | ccc |
| 30 | |||
You may modify and re-arrange your table in any way you like. I showed you the steps to take, the rest is up to you ;)
Populate table with data from different datasets
I believe by now you know for sure that a dataset is connected to table rows. But have you wondered if it is possible to add several table lines and have them populated from several datasets? Sure it is :) The procedure is totally the same except for the binding – you’ll need to do it several times (one for each dataset). That’s pretty much it :)
Now let’s get back from words to practice and create another dataset to bind it to the table from our previous example. It’ll also be some practice-free sample so that you focus your attention on the process. My second dataset would be the following:
| Key column 1 | X | Y | Z |
| A | x | y | z |
| B | xx | yy | zz |
| C | xxx | yyy | zzz |
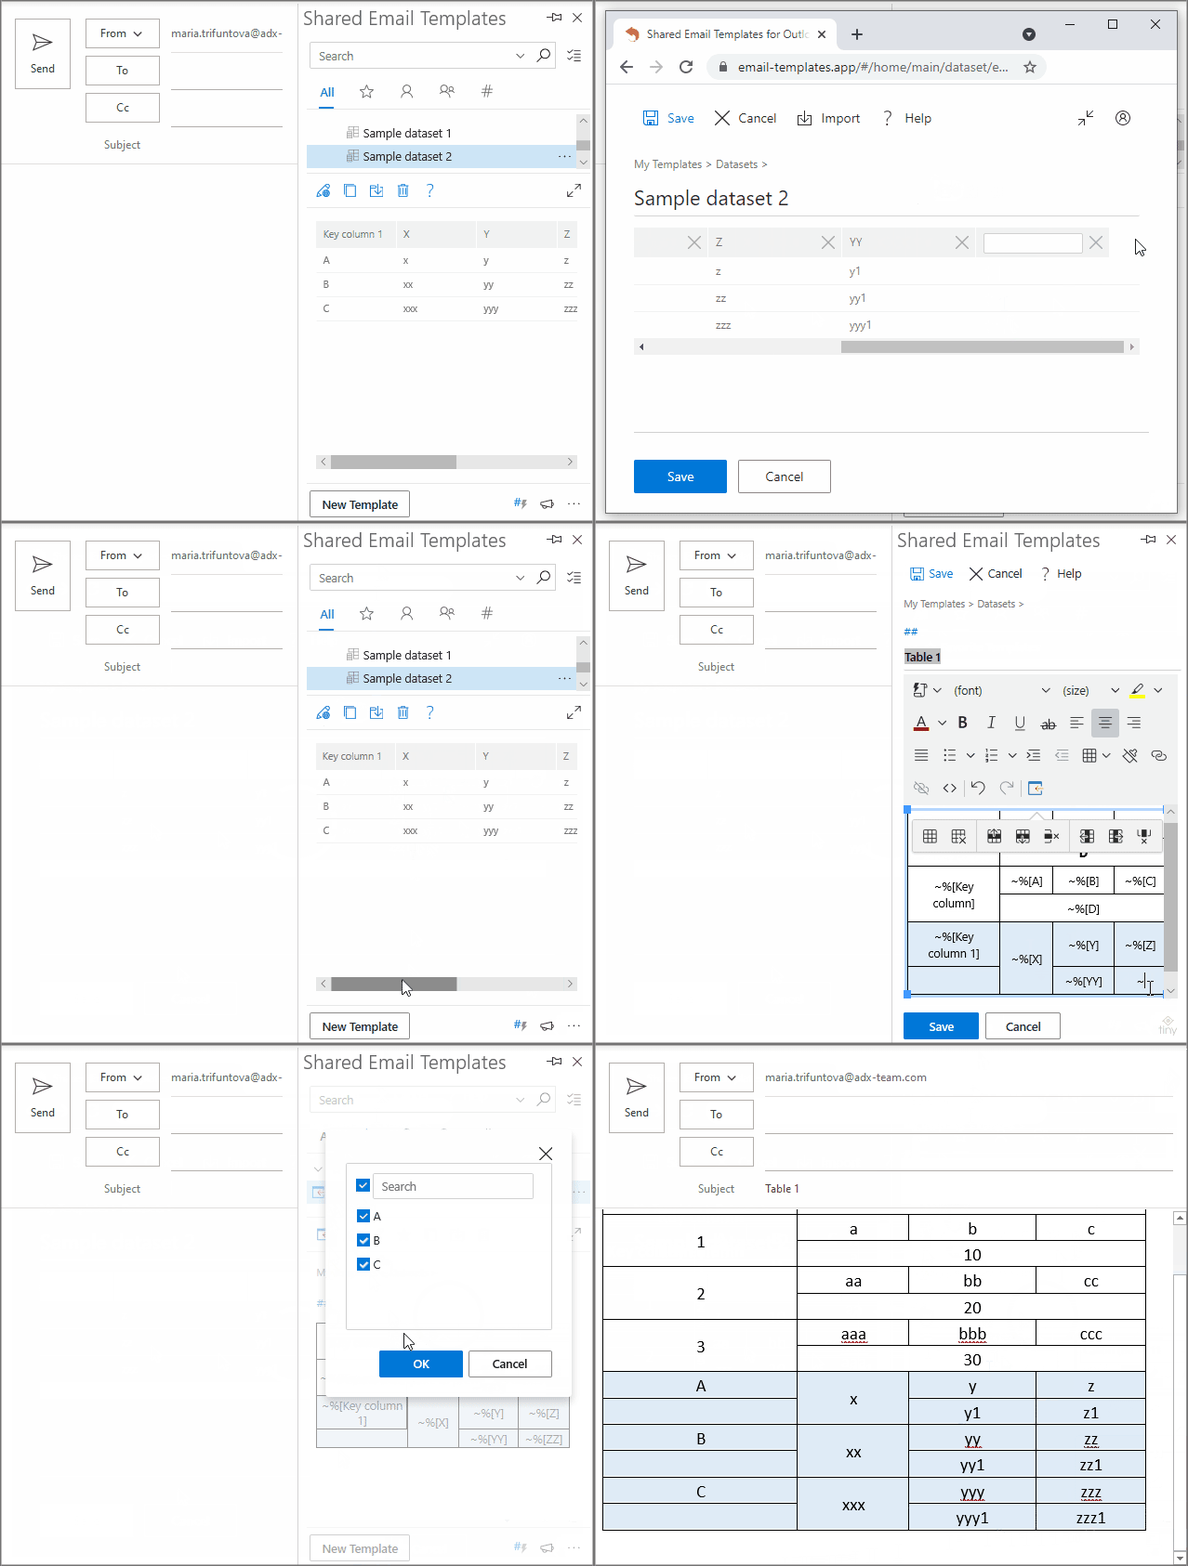
Now I’ll need to get back to my template, modify the table a little and connect to the second dataset. If you were reading my previous articles about tables and datasets carefully, you won’t face any issues with it at all ;) Anyways, I won’t leave you without explanation, so here are the steps I take:
- I start editing the template with the table and add new rows below:

- For the new rows, I choose to merge the lines of the second column:

- In order to bind the second dataset to the new rows, I select them all, right-click anywhere on the range and choose “Bind to dataset”:

Here is how my renewed template will look like after the modifications above:
| Key column | A | B | C |
| D | |||
| ~%[Key column] | ~%[A] | ~%[B] | ~%[C] |
| ~%[D] | |||
| ~%[Key column 1] | ~%[X] | ~%[Y] | ~%[Z] |
As you can see, there are a few empty cells in the final row. The thing is, the second dataset has fewer columns hence not all the cells are getting filled (there is simply nothing to stuff them with). I consider it's a good reason to teach you adding columns to existing datasets and connecting them to a table.
I’ll color the new rows in light blue so that it got catchier and more visual as we’re about to modify it a little.
Tip. As I’ve already connected this dataset to the second row, I don’t need to bind it again. I’ll simply manually enter the new rows’ names and the connection will work like a charm.
First off, I’ll start with editing my second dataset and adding 2 new columns. Then, I’ll connect those new columns to my existing table. Sounds tough? See me doing it in a couple of simple clicks :)

See? Binding is not a rocket science, it is much easier than it sounds!
If you decide to connect more datasets, just add new rows and bind them the same way you did before.
Summary
Today we had a closer look at datasets in Shared Email Templates and learned some more about their functionality and capabilities. If you have ideas on how to arrange connected datasets or, maybe, you feel like some important functionality is missing, please drop a few lines in the Comments. I’ll be happy to get feedback from you :)
 by
by